
A knowledge graph is an interconnected dataset enriched with meaning so we can reason about the underlying data and use it confidently for complex decision-making
The why?
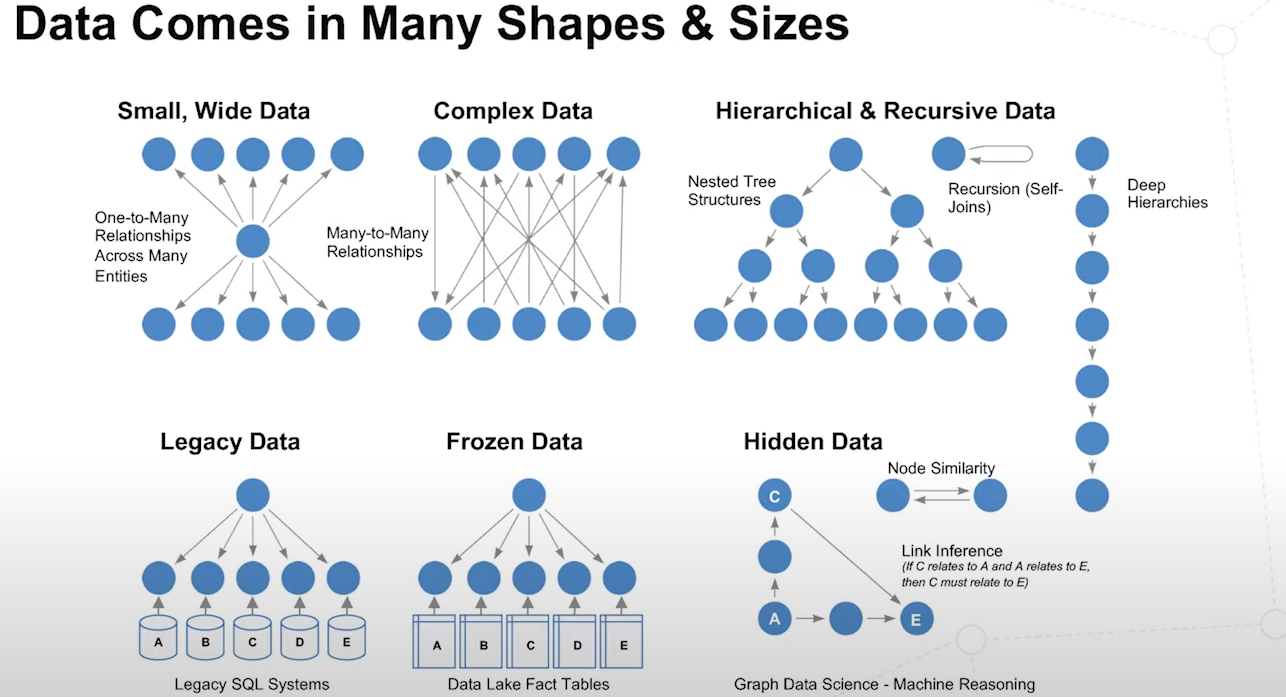
- Data is complex and of many types
- Data in orgs, is stored in silos that have relations with each other - which when harnessed, can provide very valuable information
- Small and wide data provides more context (which leads to less data hungry ML)
- Complex forms of data can be analyzed in graphs
Graphs
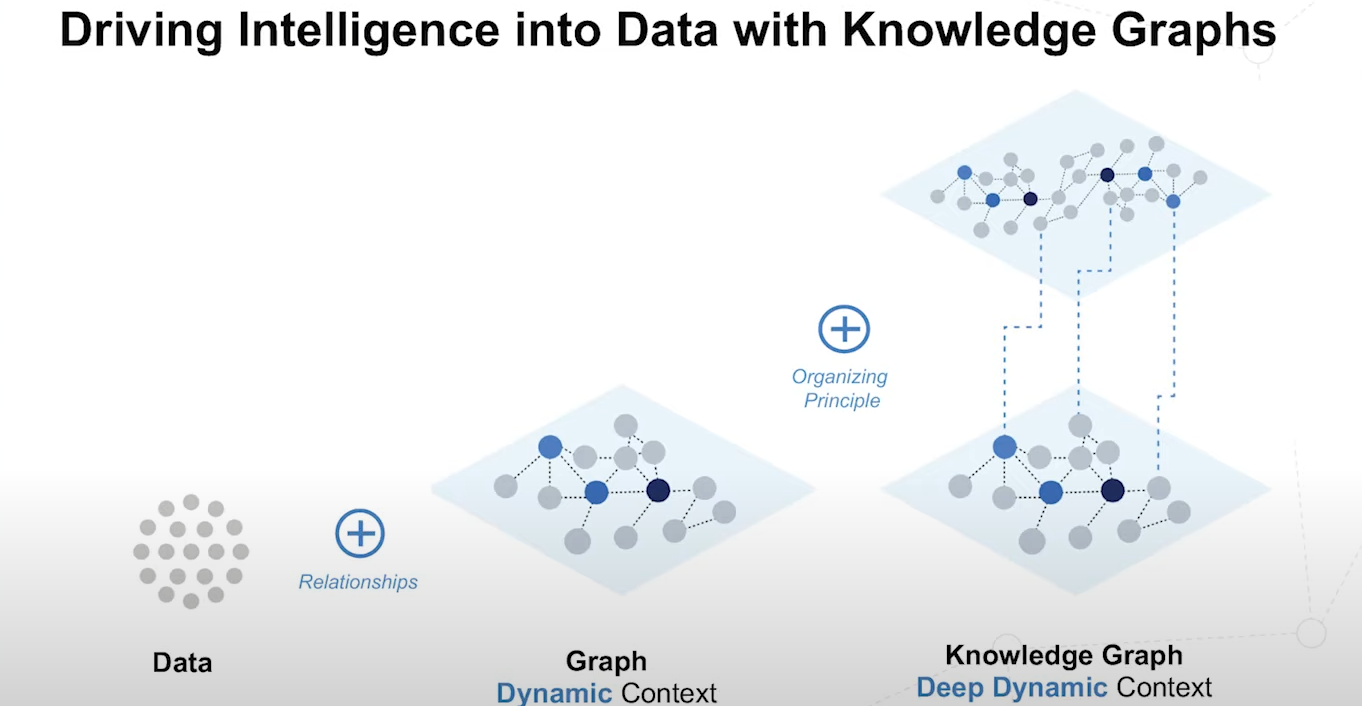
Data & relations stored together
Find relationships as quickly as data
Relationships provide 1st level of context to data aka “dynamic context”
When you take data and throw it into a dynamic structure like a graph, you get a structure that is connected contextually to all of its neighbors and those to their neighbors and so on - graph grows richer with more data → adding context dynamically
Organizing principle → comes in many forms
Knowledge Graphs (KG)
No 2 KGs are the same
Every KG is the integration of data from multiple sources When data comes from multiple sources, you have to solve the problem of identity. You have to determine that this data coming from 1 data source is the same as another chunk of data coming from another data source. Might involve merging the KG into a single node or representing them in some form that they are equivalent
On this foundation, we can divide KGs into 3 categories -💡
CATEGORY 1 - Semantic Search - Starts from a “collection of things” (eg : product descs, documents). We want to enrich this representation of these things with features about them such as
- annotations about entities mentioned in them
- classification
when we’ve enriched this representation, we overlay the domain modelling - overlay an ontology or taxonomy - allowing multiple paths for exploration, navigating from data to metadata and back to answer interesting questions
CATEGORY 2 - Pattern matching - Based on “shapes on your data”.
- Can be a star - find a highly connected node that is central to your network (maybe like a business infra that many things depend on) - a single point of failure.
- Can be a ring - indicating an unusual way in which data is flowing in your dataset that can help uncover fraudulent behavior
- Can be a chain of events - uncover a particular customer behavior, that can help predict churn
- Can be a cluster - a set of related topics, highly connected customers etc.
All these shapes are easy to identify using a graph
CATEGORY 3 - Dependency modelling - Representing dependencies. Task & resource allocation. Interesting thing about modelling dependencies is that when we provide the building blocks, like, for eg - this task depends on another - the graph will build a complete picture By giving in “direct dependencies” to graph, it will help us uncover the “indirect dependencies” (tricky ones) eg : telecoms network. When a router goes down, easy to say which incoming/outgoing connections will fail but difficult to predict higher dependencies such as what happens to the services, customers - so this is a hard thing to uncover. Dependency based KG help us uncover these
In Closing
Knowledge graphs are a very promising way of organizing data, offering a great way to build intelligence on top of them. The initial setup might be complex but the rewards once the data pipeline receives more ingress, the rewards will be exponential.
When it comes to OALP, the age SQL tables is coming to a slow end. Graph technologies will spearhead most such processes by 2025.
If there's one thing I want you to take back after this blog, is, when it comes to data intelligence :