

What is Back of the envelope?
A Back of the envelope calculation is a simple arithmetic operation frequently carried out on a little piece of paper, like an envelope. Back of the envelope analysis quickly generates a ballpark figure using approximated or rounded figures. An estimate is more accurate than a wild guess but less exact than a formal calculation using precise numbers in a spreadsheet or other program. These computations are typical for folks who have a sudden inspiration for an idea or wish to estimate a quantity quickly.
In honor of physicist Enrico Fermi, back of the envelope computations are often referred to as Fermi issues. Fermi was renowned for his ability to approximate issues accurately even with very little data.
In this article, we will talk about this methodology's history, applications, and best practices. Furthermore, I will provide a storage cost analysis of Twitter 2.0 and a cheat sheet at the end so that you can conduct your estimations. Just a disclaimer - the calculations that are about to be added, are made with heavy assumptions - looking at Twitter 2.0 as a new service that we’ll be building & basic components required for the same. The calculations don’t involve considerations of economies of scale, redundancy, replication and most estimations that involve scaling. We are just understanding a basic implementation of storage for the app, for the scale it is it
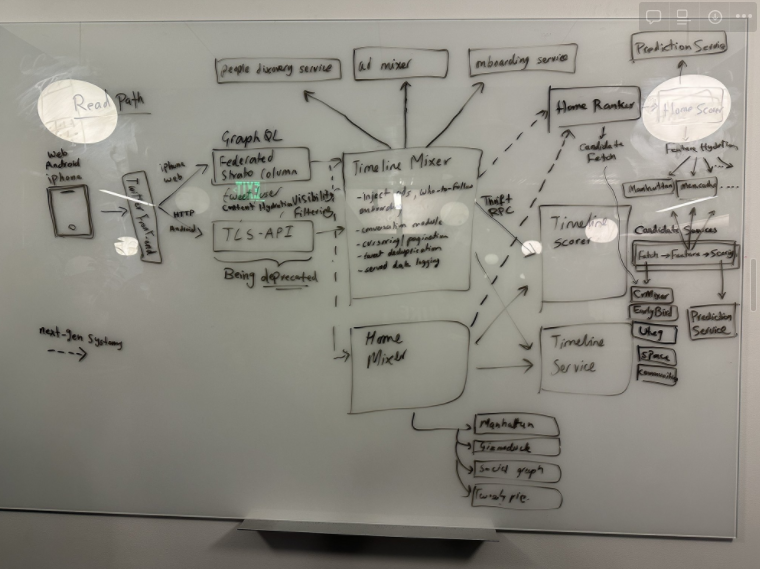
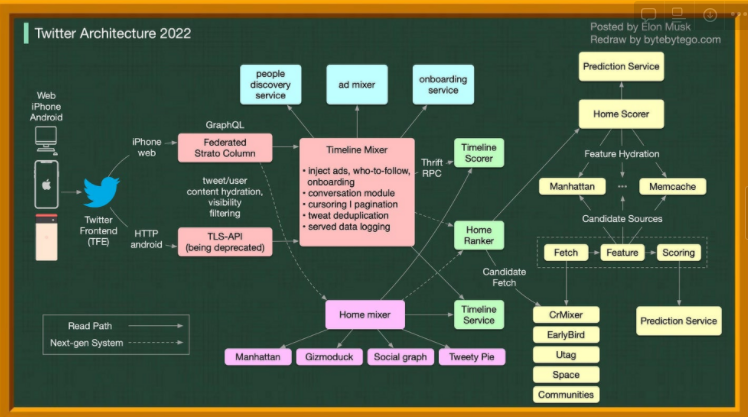
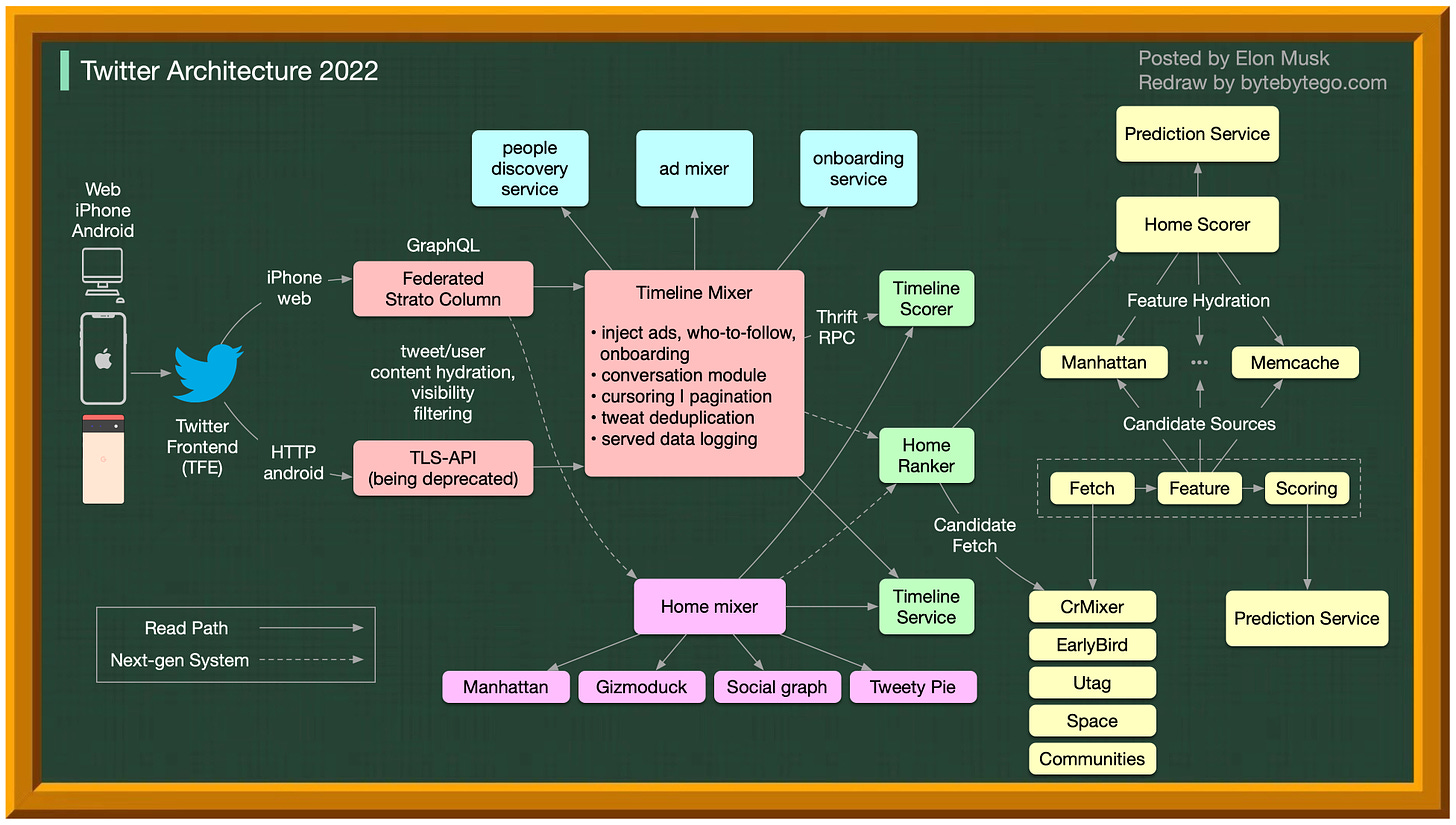
Twitter 2.0’s System Design diagram shared by Elon Musk in November 2022 - Source
Why are back of the envelope calculations needed?
The calculation generally informs us if the design can satisfy the functional requirements, such as the number of supported users, response latency, and resource needs. For instance, when deciding between different architectural designs, the simplest question to ask is whether one server is enough. To get a ballpark figure, we can quickly calculate how many servers we would require, if not one.
Notable Industry Applications
Some of the use cases where back of the envelope calculation has been used:
- An important Internet protocol, the Border Gateway Protocol, was sketcBeforein 1989 by engineers on the back of "three ketchup-stained napkins", and is still known as the three-napkin protocol.
- UTF-8, the dominant character encoding for the World Wide Web was designed by Ken Thompson and Rob Pike on a placemat.
- The Bailey bridge is a type of portable, pre-fabricated, truss bridge and was extensively used by British, Canadian and US military engineering units. Donald Bailey drew the original design for the bridge on the back of an envelope.
- The Laffer Curve, which claims to show the relationship between tax cuts and government income, was drawn by Arthur Laffer in 1974 on a bar napkin to show an aide to President Gerald R. Ford why the federal government should cut taxes.
We've looked at some of the important historical applications of the back of the envelope, now we'll examine the arithmetic process to see how we can utilise it to solve our own issues. This will help you retain this knowledge as well as expand your understanding of how these calculations work.
Getting Started with Back of the Envelope
Whenever we try to learn something new, we have to be well-versed with the most basic & frequently used tools. Similarly, when beginning system design estimations, we have to know certain common numbers that help us consolidate our understanding. A subset of these numbers, used for estimating the speed of a system, are known as “Latency Numbers.” Latency, as a term, helps measure the time it will take for data to pass from one point in a network to another. It is measured in milliseconds for most systems. For example, the latency of the best video chat applications, such as Google Meet is 100 milliseconds or less. This means it takes 100 milliseconds or less for data to be exchanged between the video chat participants’ computers.
How can we implement this?
Before approximating the real utilization, we must acknowledge that our system has limited resources. For instance, we want to know if we can handle all user requests on a single server despite our servers only being equipped with 2GHz CPUs.
How can we guess the real usage?
The utilization must be divided into its component parts before being roughly estimated (and, if necessary, further divided) and combined.
For instance, we might anticipate 1K active users, each of whom submits 15 requests daily.
15K requests per day, or 15K/86400 requests per second, are involved.
An effective method for assembling the components is to round tightly. Nobody likes to multiply by 86400. To give 0.2 seconds to serve a single request, let's round to 20K/100K. We need to set up at least 4 computers if we know that it takes 0.7 seconds to serve one request. Of course, you don't want to live on the edge, so let's increase the number of machines by a buffer and make it ten.
How to calculate quickly
If someone asked you to calculate: 2456000 x 4598; that would slow things down, wouldn’t it?
The simpler way to calculate quickly would be instead of spelling down a whole number, use small numbers paired with an abbreviation for magnitude (or, if necessary, exponents). 1K as opposed to 1000.
When given a huge, excessively exact number, such as 7432, immediately translate it to 7K. Anyhow, you are estimating.
This format for numbers makes multiplication and division quick.
KK is M. [K is Kilo; M is Mega]
G/M is K. [G is Giga]
4K7M = 28G.
Round both of them towards a small multiple of a power of 2 or 10 to work with larger numbers.
- 2714 ~= 3010 = 3000.
- 6500/250 ~= 6400/256 ~= 100 * 2^6 / 2^8 ~= 100 / 2^2 = 25.
Where to start Back of the envelope?
List the common use-cases of the system and decide which critical resources they require. You'll need a lot of storage for a document repository. Estimating document counts and sizes is a good place to start, but further usage will determine specifics. How frequently do new papers get added? The papers - can you search them? Are any indices required? Is the app more read-heavy or write-heavy?
Varied use cases will probably require significantly different resource shapes. For instance, serving documents might require a lot of RAM but not CPU, whereas preprocessing new documents would require CPU but not RAM. Since you need to purchase machines that are maxed out on both dimensions, hosting all those services on homogeneous machines would waste CPU and RAM.
Such differences indicate those features should be split to different services, hosted on independent sets of machines.
Real-world case study - Storage Costs borne by Twitter
Problem: Estimate Twitter QPS and storage requirements
Please note the following numbers are for this exercise only as they are not real numbers from Twitter.
Assumptions:
- 300 million monthly active users.
- 50% of users use Twitter daily.
- Users post 2 tweets per day on average.
- 10% of tweets contain media.
- Data is stored for 5 years.
Estimations:
Query per second (QPS) estimate:
- Daily active users (DAU) = 300 million * 50% = 150 million
- Tweets QPS = 150 million * 2 tweets / 24 hour / 3600 seconds = ~3500
- Peek QPS = 2 * QPS = ~7000
Let’s start solving
There are 2 important queries that need to be addressed for any system:
- “Requests per second” at the server level
- “Queries per second” at the database level.
Let’s start with “requests per second” & what inputs are required to estimate its number
- Users: Twitter has 300 million active MAUs. Not every user on Twitter is an active post-maker. 50% use daily - 150 million DAU
- Usage per DAU: 10-25% make a tweet. Again, this doesn’t have to be exact; getting within an order of magnitude should be fine. Say each DAU, on average, makes 2 tweets: so 0.25%*2 = 0.5 tweets per DAU.
- Scaling factor: Usage rate for a service has peaks & valleys throughout the day. Eg: The usage rate for your favorite e-commerce store or food delivery app will heavily increase in the case of discounts or sales in a particular festive season. We need to estimate how high the traffic would peak compared to the average. This would reflect the request per second peak where the design could potentially break. Most people tweet in the morning, so the tweet creation traffic is twice the average when US east coast wakes up.
- Thus, total tweets in a day = 150 M DAU * (0.5 tweets/DAU) * (2x scaling factor in the morning)
- Thus, requests per second = n/(number of seconds in a day) = n/86400 ~ 1500 tweets per second.
Let’s now look at how much storage is required for storing multimedia files for tweets.
- 150 million daily tweets. Say 10% of these tweets contain pictures of average size 300kB each & 1% of tweets contain videos of about 50MB each.
- Let’s assume that the files are replicated with 3 copies each & atleast stored for 5 years.
- Storage required for pictures = (150 M tweets per day)* (0.1 of tweets have images)* 300kB (image size) * 3copies = 13.5TB.
- Storage required for videos per day = (150 M tweets per day)* (0.01 of tweets have videos) * (50MB video size) * 3copies ~ 225TB.
- Total storage required for multimedia files per day = 238.5TB
- Just the text for a tweet can be stored within 160B (i.e. 1280 bits ~ 160 characters per tweet on average)
Storage required for tweets per day = 150 M * (160B tweet size) * 3copies = 72GB
Let’s calculate overall storage cost for Twitter
Thus, we learnt that, for running Twitter, in the most basic sense, the following requirements must be met:
- Assuming no data compression & our simple 3x replication, in the most basic form - 238.5TB blob storage required for storing all the multimedia of tweets that arrive in a day. 72 GB storage in database is required just for storing the basic tweet content.
- Twitter was founded in 2006. However, it launched image sharing in 2011 & video sharing in 2013.
- Thus, we can assume, that average storage required per day for videos uploaded by a growing user base can be our current estimate multiplied by a normalization factor of 0.6 (considering 15% of user growth on average, every year, since year of founding).
- Thus, we have about (225TB video storage per day) * (365 days in a year) * (9 years since video sharing was launched) * 0.6 = 443.5PB videos stored.
- Similarly for image storage we have (13.5TB photo storage per day) * (365 days in a year) * (11 years since video sharing was launched) * 0.6 = 32.52PB images stored
- To store total multimedia for 11 years worth tweets, in the most fault tolerant & redundant manner, we need - 443.5+32.52 ~ 476.02PB (this figure is close to the actual ballpark around 500PB that Twitter has officially shared here)
- Twitter uses AWS for storage of tweets & accompanying multimedia files. Say we use intelligent tiering by S3 to pay for data, that is most recent & popularly accessed. Other data, we can archive, & fetch on demand & pay for.
Estimating the media storage cost
- 476.02PB can be broken down into, say - 300 PB till 2019 (considering that video & images got introduced late) and 276PB after 2017.
- Assuming the worst case pricing of S3 (the standard pricing) - All the multimedia of the last 3 years’ tweets can be stored in S3 regular access & the other, can be stored in S3 archives (so we save cost) Thus, as per S3 pricing values, we end up paying:
For 300PB in archive: 308,073.20 USD monthly
For 276PB in regular tier: 5,935,645.70 USD monthly - Every year, our estimate of Twitter, pays 6,243,718.90 USD monthly, to store our images & videos.
Estimating the database cost for our tweets
- Let’s use AWS relational database DynamoDB to store tweet data in a structured form - such as user info, tweet text, number of likes & retweets.
- Twitter needs to store 72GB of tweets in a regular relational database, each day, to keep the lights on.
- Again, estimating our normalization factor of 0.6 to aggregate tweet data, across 16 years since Twitter supporting text sharing right from the start, we get - (72 GB tweet data per day) *(365 days)* (16 years since tweeting was launched) * 0.6 = 252.28TB
- Thus, using a standard on-demand DynamoDB (unoptimized for cost, but great for scale) - the storage cost comes to 603,355.92 USD monthly, to store our data.
- For an actual analysis of all the databases Twitter uses, checkout this reference link
Here’s the actual AWS calculator cost estimation performed for this purpose.
Thus, this most basic, unoptimized design of that we made, pays 82,164,897.81 USD = 82 million USD every year to AWS, to keep providing its storage services only.
We have not even begun to discuss the computing costs, the data science costs in the cloud. Also, to keep this article a light read, we haven’t taken into consideration scalability solutions such as caching, multi-AZ databases and several aspects of storage itself.
Thus, you might now understand why Elon Musk is bent on optimizing this system a lot & even implementing the “Deep Cuts” plan to reduce infrastructure costs by a billion. But trying to fire 50% of the workforce and have the rest leave because the ship is sinking still doesn't make sense. To top it off, if your major problem is infrastructure cost you don't fire engineers, you task engineers to reduce infrastructure costs. Now, we may not agree or disagree with this logic, but atleast we’ve learnt how to ballpark the financial element of the same.
Cheat Sheet for Back of the Envelope
We studied a way of estimating the storage cost borne by Twitter. But what about getting the speed of a video-game streaming platform? Or the requests per second of a payment gateway?
Fear not, here are a few important numbers that we can use to estimate useful metrics of any software system & what corresponding technical requirements it must be able to satisfy.
For estimating storage
Byte Number Sizes
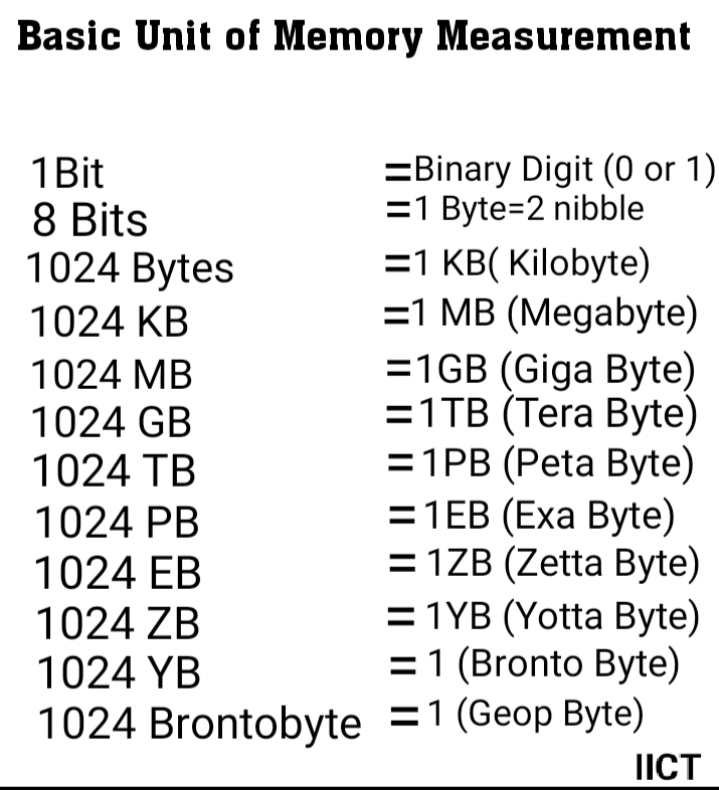
Image Source
Data
The numbers vary depending on the language and implementation.
- char: 1B (8 bits)
- char (Unicode): 2B (16 bits)
- Short: 2B (16 bits)
- Int: 4B (32 bits)
- Long: 8B (64 bits)
- UUID/GUID: 16B
Objects
- File: 100 KB
- Web Page: 100 KB (not including images)
- Picture: 200 KB
- Short Posted Video: 2MB
- Steaming Video: 50MB per minute
- Long/Lat: 8B
For estimating load in a given time duration
The following numbers are heavily rounded and help determine how often something needs to happen over a period of time. For example, if a server has a million requests per day, it will need to handle 12 requests per second.
Use the table below to convert requests handled by server across different durations of time
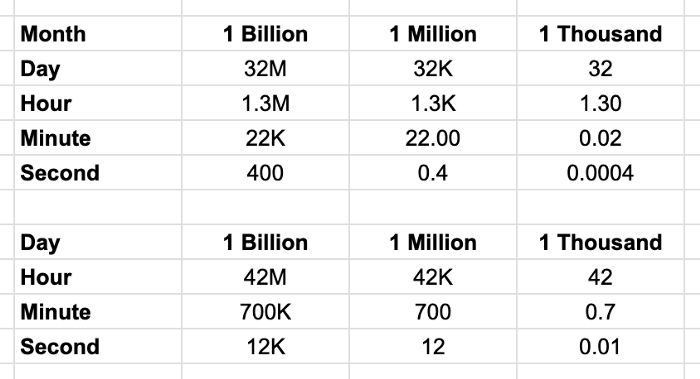
Heavily rounded per time period numbers.
For estimating average database limitations
SQL Databases
- Storage: 60TB
- Connections: 30K
- Requests: 25K per second
Cache: using Redis (key-value database)
Storage benchmarks available in docs. To get client connections capacity- refer link
- Storage: 300 GB
- Connections: 10k
- Requests: 100k per second
For estimating average microservice limitations
Web Servers: Requests: 5–10k requests per second
Queues/Streams - Requests: 1000–3000 requests/s. Throughput: 1MB-50MB/s (Write) / 2MB-100MB/s (Read)
Example queue service limits - Pub/Sub — limits, Kinesis — limits, SQS — limits
Scrapers - Requests: 1000 per second. Example scraper service - Colly — go scraper
For estimating speed/latency of the system
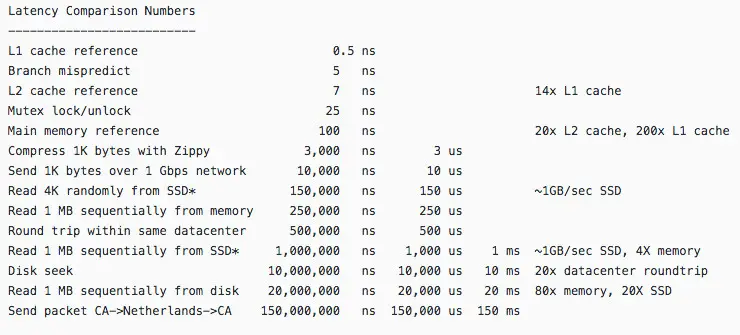
These 14 latency numbers, revealed by Dr. Dean (Google), form the foundation of systems designing & performance optimization. Using these numbers we can predict how long it would take for a system to perform its computations. Refer to this website and the image below as a simple lookup for these numbers
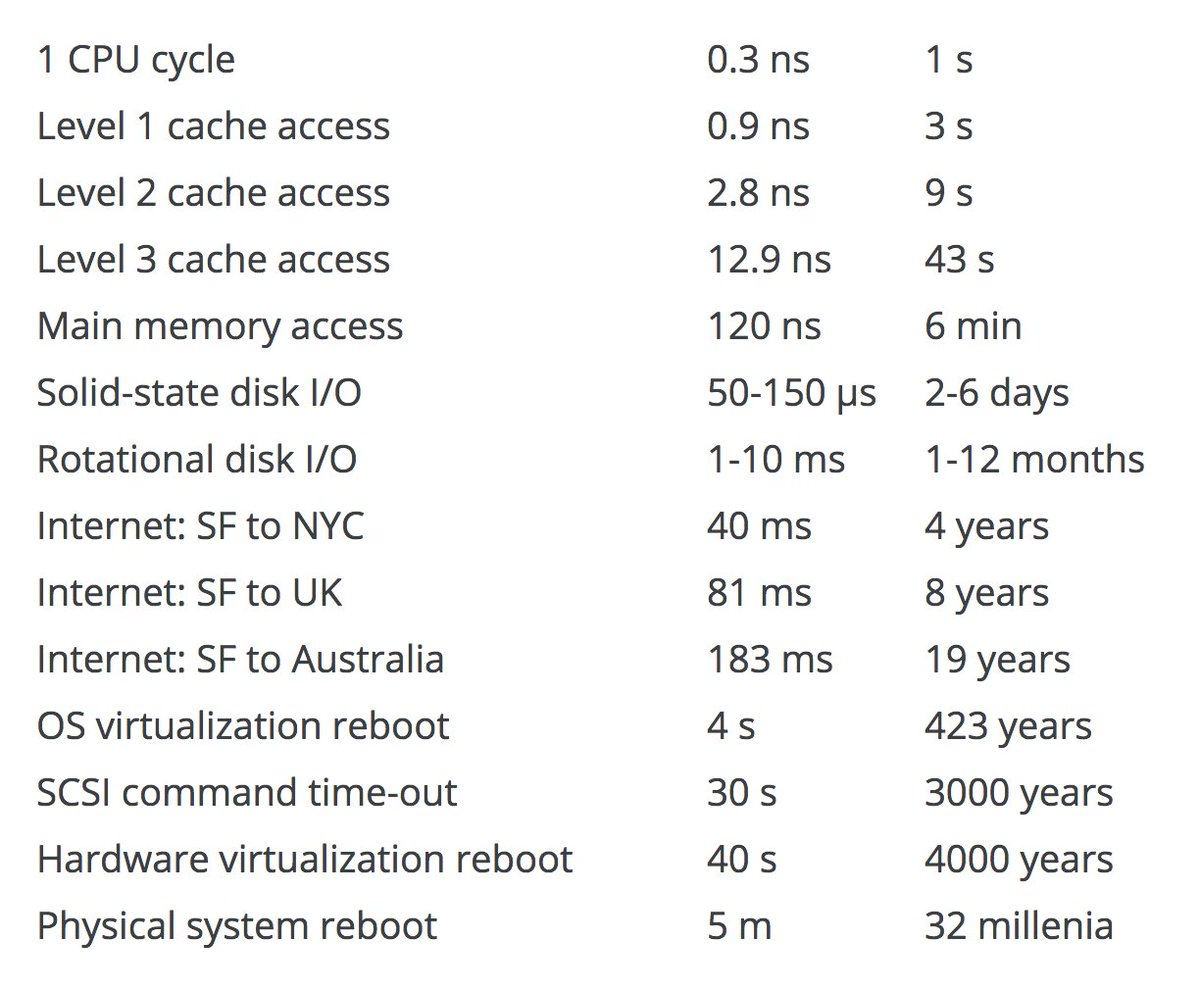
Image Source
What do we understand from this
- Memory is fast, but the disk is slow.
- Avoid disk seeks if possible.
- Simple compression algorithms are fast.
- Compress data before sending it over the internet if possible.
- Data centers are usually in different regions, and it takes time to send data between them.
In a nutshell
A lot of back of the envelope calculations are done with just coefficients and exponents, e.g., c∗10e. Your goal is to get within an order of magnitude right that’s just e, c matters a lot less.
What did we learn
- Back of the envelope calculations allow you to take a look at different variations.
- When designing your system, these are the kind of calculations you should do over and over in your head.
- Know the back of the envelope numbers for the building blocks of your system. It's not good enough to just know the generic performance numbers, you have to know how your subsystems perform. You can't make decent back of the envelope calculations if you don't know what's happening.
- Monitor and measure every part of your system so you can make these sorts of projections from real data.
I hope you understood how systems are operated in terms of estimating engineering infrastructure requirements, provisions & costing. What’s the one system that you want me to target next for back of the envelope analysis?
